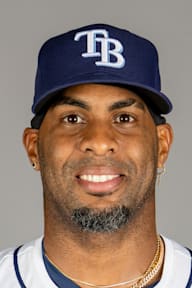

87% season-shape match
Why he matters right now
Yandy Díaz is top-10 in the majors in hits and batting average
He is 4th in hits at 180, 9th in batting average at .293 — placements on MLB's own season boards, which rank every QUALIFIED hitter in the sport rather than the few dozen this site tracks. Qualified is MLB's own bar, and it is the reason a part-season player with a big number is not on these boards at all.
This has been his headline for 37 straight days.
The case in 30 seconds
- 180 4th in hits at 180, 9th in batting average at .293 on MLB's season leaderboards MLB season leaderboard (the league's own top-10 board of qualified players, not this site's roster)
- .293 .805 OPS, 22 home runs, 85 RBI and 3 stolen bases over 154 games snapshot batting board — the union of MLB's top-10 hitting boards, then MLB's 3.1 PA per team game rule applied; not the league's full qualified pool
The honest caveat
It is still a partial season — 686 plate appearances so far. A rate moves fastest against the strongest arms a schedule has left, and the schedule ahead is not the schedule behind.
Every claim above, with its source (2)
- 4th in hits at 180, 9th in batting average at .293 on MLB's season leaderboards MLB season leaderboard (the league's own top-10 board of qualified players, not this site's roster)
- .805 OPS, 22 home runs, 85 RBI and 3 stolen bases over 154 games snapshot batting board — the union of MLB's top-10 hitting boards, then MLB's 3.1 PA per team game rule applied; not the league's full qualified pool
The evidence
Situational splits
| Split | AB | AVG | HR | RBI | OPS |
|---|---|---|---|---|---|
| vs RHP | 436 | .305 | 14 | 58 | .816 |
| vs LHP | 178 | .264 | 8 | 27 | .780 |
| Home | 292 | .318 | 16 | 47 | .920 |
| Away | 322 | .270 | 6 | 38 | .701 |
| Day | 241 | .324 | 4 | 32 | .781 |
| Night | 373 | .273 | 18 | 53 | .821 |
2026 season, MLB Stats API. A split with no plate appearances is omitted rather than shown as zeroes.
154G
614AB
180H
.293AVG
22HR
85RBI
3SB
262B
13B
.805OPS
Chasing .400
.293Current AVG
110Consecutive hits needed to reach .400
106-for-100Needed over next 100 AB
—Rest-of-season AVG to finish .400 (66-for-0)
Status: IMPOSSIBLE
Milestone tracker
| Chase | Target | Current | Pace | Needed from here | Status |
|---|---|---|---|---|---|
| .350 AVG | .350 | .293 | .293 | — | IMPOSSIBLE |
| .380 AVG | .380 | .293 | .293 | — | IMPOSSIBLE |
| .400 AVG | .400 | .293 | .293 | — | IMPOSSIBLE |
| .406 AVG | .406 | .293 | .293 | — | IMPOSSIBLE |
| .466 AVG | .466 | .293 | .293 | — | IMPOSSIBLE |
| 50 HR | 50 | 22 | 22 | 28 in 0 g | IMPOSSIBLE |
| 60 HR | 60 | 22 | 22 | 38 in 0 g | IMPOSSIBLE |
| 62 HR | 62 | 22 | 22 | 40 in 0 g | IMPOSSIBLE |
| 70 HR | 70 | 22 | 22 | 48 in 0 g | IMPOSSIBLE |
| 73 HR | 73 | 22 | 22 | 51 in 0 g | IMPOSSIBLE |
| 200 Hits | 200 | 180 | 180 | 20 in 0 g | IMPOSSIBLE |
| 225 Hits | 225 | 180 | 180 | 45 in 0 g | IMPOSSIBLE |
| 250 Hits | 250 | 180 | 180 | 70 in 0 g | IMPOSSIBLE |
| 262 Hits | 262 | 180 | 180 | 82 in 0 g | IMPOSSIBLE |
| 50 SB | 50 | 3 | 3 | 47 in 0 g | IMPOSSIBLE |
| 80 SB | 80 | 3 | 3 | 77 in 0 g | IMPOSSIBLE |
| 100 SB | 100 | 3 | 3 | 97 in 0 g | IMPOSSIBLE |
| 130 SB | 130 | 3 | 3 | 127 in 0 g | IMPOSSIBLE |
| 50 2B | 50 | 26 | 26 | 24 in 0 g | IMPOSSIBLE |
| 60 2B | 60 | 26 | 26 | 34 in 0 g | IMPOSSIBLE |
| 67 2B | 67 | 26 | 26 | 41 in 0 g | IMPOSSIBLE |
| 20 3B | 20 | 1 | 1 | 19 in 0 g | IMPOSSIBLE |
| 25 3B | 25 | 1 | 1 | 24 in 0 g | IMPOSSIBLE |
| 36 3B | 36 | 1 | 1 | 35 in 0 g | IMPOSSIBLE |
| 125 RBI | 125 | 85 | 85 | 40 in 0 g | IMPOSSIBLE |
| 150 RBI | 150 | 85 | 85 | 65 in 0 g | IMPOSSIBLE |
| 175 RBI | 175 | 85 | 85 | 90 in 0 g | IMPOSSIBLE |
| 191 RBI | 191 | 85 | 85 | 106 in 0 g | IMPOSSIBLE |
How likely is the finish?
0%finishes with 40+ home runs
0%finishes with 50+ home runs
0%finishes with 60+ home runs
His rate of 32.070 home runs per 1,000 plate appearances is read as 31.750 after regressing toward the league's 30.200 — a leaderboard selects for players who have outperformed, so an unregressed rate projected forward overstates every one of them. That puts the expected finish at 22.0, against a straight team-game pace of 22. Exact beta-binomial over 0 remaining plate appearances, averaged across playing-time scenarios. Calibrated against Retrosheet finishes: within 7 points of observed frequency in every band, and within 2 in three of five. It is a model, not a measurement.
Home run pace vs the benchmark seasons
0.0%of comparable chases reached 40 HR
0.0%of comparable chases reached 50 HR
0.0%of comparable chases reached 60 HR
Empirical: seasons within ±2 HR of his total at the same team-game checkpoint (n=1788); median finish 22. Retrosheet.
Recent game log
Derived nightly from the snapshot ledger — each row is the difference between consecutive days; multi-day rows are labeled.
| Date | Opp | Result | AB | H | HR | RBI | R | SB | BB | K | AVG |
|---|---|---|---|---|---|---|---|---|---|---|---|
| 2026-10-01 (6d) | — | — | 4 | 3 | 0 | 0 | 3 | 0 | 0 | 0 | .293 |
| 2026-09-25 | Philadelphia Phillies | W 2-0 | 4 | 0 | 0 | 0 | 0 | 0 | 0 | 0 | .290 |
| 2026-09-24 | New York Yankees | L 4-6 | 4 | 2 | 0 | 0 | 2 | 0 | 1 | 0 | .292 |
| 2026-09-22 | New York Yankees | L 0-2 | 9 | 2 | 0 | 4 | 0 | 0 | 0 | 2 | .291 |
| 2026-09-20 | Boston Red Sox | W 5-1 | 3 | 0 | 0 | 0 | 1 | 0 | 1 | 0 | .292 |
| 2026-09-18 | Boston Red Sox | L 2-4 | 3 | 0 | 0 | 0 | 1 | 0 | 2 | 1 | .293 |
| 2026-09-17 | Athletics | W 10-1 | 5 | 0 | 0 | 0 | 0 | 0 | 0 | 2 | .295 |
| 2026-09-16 | Athletics | W 4-3 | 4 | 0 | 0 | 0 | 0 | 0 | 0 | 0 | .297 |
| 2026-09-15 | Athletics | W 2-1 | 4 | 0 | 0 | 0 | 0 | 0 | 0 | 1 | .299 |
| 2026-09-13 | Houston Astros | W 14-4 | 5 | 2 | 0 | 1 | 2 | 0 | 0 | 0 | .301 |
Recent highlights
Lahman + Retrosheet context
How this season fits history
Through 162 team games; 73 in 2001