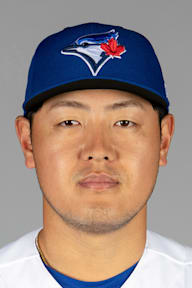

87% season-shape match
Why he matters right now
Kazuma Okamoto is top-10 in the majors in home runs
He is 10th in home runs at 31 — placements on MLB's own season boards, which rank every QUALIFIED hitter in the sport rather than the few dozen this site tracks. Qualified is MLB's own bar, and it is the reason a part-season player with a big number is not on these boards at all.
New on this page tonight.
The case in 30 seconds
- 31 10th in home runs at 31 on MLB's season leaderboards MLB season leaderboard (the league's own top-10 board of qualified players, not this site's roster)
- on the 2026 rookie leaderboard (31 HR) snapshot rookie_leaders board
The honest caveat
A top-ten finish is a position on a board, not a verdict on a player. The men just below him on it are not meaningfully worse, and one good week moves several places.
What to watch next
Next up: vs Baltimore Orioles.
Every claim above, with its source (2)
- 10th in home runs at 31 on MLB's season leaderboards MLB season leaderboard (the league's own top-10 board of qualified players, not this site's roster)
- on the 2026 rookie leaderboard (31 HR) snapshot rookie_leaders board
Other cases this page considered and did not lead with: Kazuma Okamoto is doing this in his first big-league season.
The evidence
What to watch next
vs Baltimore Orioles
Rogers Centre · 3:07 p.m. ET
Facing Kyle Bradish
Kazuma Okamoto faces a right-hander in Kyle Bradish. He is hitting .229 with 22 home runs in 385 at-bats against right-handers this season.
Situational splits
| Split | AB | AVG | HR | RBI | OPS |
|---|---|---|---|---|---|
| vs RHP | 385 | .229 | 22 | 66 | .736 |
| vs LHP | 136 | .250 | 9 | 18 | .848 |
| Home | 241 | .237 | 13 | 39 | .757 |
| Away | 280 | .232 | 18 | 45 | .773 |
| Day | 226 | .226 | 11 | 37 | .729 |
| Night | 295 | .241 | 20 | 47 | .793 |
2026 season, MLB Stats API. A split with no plate appearances is omitted rather than shown as zeroes.
142G
521AB
122H
.234AVG
31HR
84RBI
1SB
242B
03B
.766OPS
Chasing .400
.234Current AVG
145Consecutive hits needed to reach .400
127-for-100Needed over next 100 AB
2.163Rest-of-season AVG to finish .400 (106-for-49)
Status: IMPOSSIBLE
Milestone tracker
| Chase | Target | Current | Pace | Needed from here | Status |
|---|---|---|---|---|---|
| .350 AVG | .350 | .234 | .234 | 1.592 ROS | IMPOSSIBLE |
| .380 AVG | .380 | .234 | .234 | 1.939 ROS | IMPOSSIBLE |
| .400 AVG | .400 | .234 | .234 | 2.163 ROS | IMPOSSIBLE |
| .406 AVG | .406 | .234 | .234 | 2.245 ROS | IMPOSSIBLE |
| .466 AVG | .466 | .234 | .234 | 2.939 ROS | IMPOSSIBLE |
| 50 HR | 50 | 31 | 34 | 19 in 14 g · 1 per 2.6 AB | EXTREME |
| 60 HR | 60 | 31 | 34 | 29 in 14 g · 1 per 1.7 AB | EXTREME |
| 62 HR | 62 | 31 | 34 | 31 in 14 g · 1 per 1.6 AB | EXTREME |
| 70 HR | 70 | 31 | 34 | 39 in 14 g · 1 per 1.3 AB | EXTREME |
| 73 HR | 73 | 31 | 34 | 42 in 14 g · 1 per 1.2 AB | EXTREME |
| 200 Hits | 200 | 122 | 134 | 78 in 14 g | EXTREME |
| 225 Hits | 225 | 122 | 134 | 103 in 14 g | EXTREME |
| 250 Hits | 250 | 122 | 134 | 128 in 14 g | EXTREME |
| 262 Hits | 262 | 122 | 134 | 140 in 14 g | EXTREME |
| 50 SB | 50 | 1 | 1 | 49 in 14 g | EXTREME |
| 80 SB | 80 | 1 | 1 | 79 in 14 g | EXTREME |
| 100 SB | 100 | 1 | 1 | 99 in 14 g | EXTREME |
| 130 SB | 130 | 1 | 1 | 129 in 14 g | EXTREME |
| 50 2B | 50 | 24 | 26 | 26 in 14 g | EXTREME |
| 60 2B | 60 | 24 | 26 | 36 in 14 g | EXTREME |
| 67 2B | 67 | 24 | 26 | 43 in 14 g | EXTREME |
| 20 3B | 20 | 0 | 0 | 20 in 14 g | EXTREME |
| 25 3B | 25 | 0 | 0 | 25 in 14 g | EXTREME |
| 36 3B | 36 | 0 | 0 | 36 in 14 g | EXTREME |
| 125 RBI | 125 | 84 | 92 | 41 in 14 g | EXTREME |
| 150 RBI | 150 | 84 | 92 | 66 in 14 g | EXTREME |
| 175 RBI | 175 | 84 | 92 | 91 in 14 g | EXTREME |
| 191 RBI | 191 | 84 | 92 | 107 in 14 g | EXTREME |
How likely is the finish?
0%finishes with 40+ home runs
0%finishes with 50+ home runs
0%finishes with 60+ home runs
His rate of 53.450 home runs per 1,000 plate appearances is read as 48.920 after regressing toward the league's 30.170 — a leaderboard selects for players who have outperformed, so an unregressed rate projected forward overstates every one of them. That puts the expected finish at 33.2, against a straight team-game pace of 34. Exact beta-binomial over 55 remaining plate appearances, averaged across playing-time scenarios. Calibrated against Retrosheet finishes: within 7 points of observed frequency in every band, and within 2 in three of five. It is a model, not a measurement.
Home run pace vs the benchmark seasons
0.4%of comparable chases reached 40 HR
0.0%of comparable chases reached 50 HR
0.0%of comparable chases reached 60 HR
Empirical: seasons within ±2 HR of his total at the same team-game checkpoint (n=677); median finish 32. Retrosheet.
Recent highlights
▶︎
Kazuma Okamoto's go-ahead single2026-09-05 · Kazuma Okamoto's tiebreaking single in the 7th put the Blue Jays ahead for good in a 4-3 win over the Royals
▶︎
Kazuma Okamoto's go-ahead single2026-08-12 · Kazuma Okamoto's tiebreaking single in the 8th put the Blue Jays ahead for good in a 6-4 win over the Red Sox
Lahman + Retrosheet context
How this season fits history
Through 148 team games; 64 in 2001