Gavin Williams (CLE) threw an IMMACULATE INNING (inning 4: 3 K on 9 pitches) ▶︎ watch.
Historic Chases · 2026-07-23
Nightly briefing
Baseball last night
Kyle Schwarber (PHI) has struck out 154 times, projecting to 242. Mark Reynolds' record is 223. That pace would be the most strikeouts in any season since 1901. But he's doing damage too: he is 2nd in MLB in home runs (33) — one every 11.2 at-bats. The strikeouts are the price of the power.
The AL West is a coin flip: Rangers (51-51) lead Mariners by 0.5. The Rays' single-season record is 46 home runs, set by Carlos Pena in 2007. Junior Caminero (TB) projects to 46 and would tie it.
Lines of the night: Jack Anderson earned his first career save ▶︎ watch.
What changed from last season: Jackson Merrill (SD) — stolen bases up from 1 in 115 games in 2025 to 20 in 100 this season; Pete Crow-Armstrong (CHC) — walk rate up from 4.7% to 12.1% (29 in 620 plate appearances in 2025, 52 in 431 this season); Junior Caminero (TB) — walk rate up from 6.4% to 12.8% (41 in 643 plate appearances in 2025, 57 in 444 this season). 3 of 312 rate comparisons across 61 men on this season's leaderboards, corrected for having looked that many times.
Start streaks: Gavin Williams (CLE) has struck out 8 or more in each of his last three starts (11, 11, 11).
The so-what: Yordan Alvarez (HOU) has 34 home runs through 104 team games, a 53-homer pace — 11 behind Bonds's 2001 total at the same point (45 of his eventual 73). That gap is the whole story: it closes, or the chase does.
Historical intelligence
How the night stacked up
Yordan Alvarez versus the great home-run seasons
Yordan Alvarez has 34 home runs through 104 team games, 11 behind Barry Bonds's 2001 pace at the same checkpoint (45). Comparable chases finished with a median of 46; 23.7% reached 50 and 2.2% reached 60 (n=93).
Retrosheet · verified play-by-playA projected top-22 season
If James Wood finishes at the current projection of 148, it would rank No. 22 among all seasons since 1901 — only 21 finished higher.
SABR Lahman Baseball Database · through 2021This is an unusual batter-strikeout climate
MLB teams are averaging 8.38 batter-strikeout events per team game. The last completed season at least this high was 2021. The stored historical peak is 8.81 in 2019.
SABR Lahman Baseball Database · through 2021Closest to .400

Otto Lopez
MIA
.332AVG
45 consecutive hits needed to reach .400
EXTREME
Home Run Leader

Yordan Alvarez
HOU
34HR
53 projected HR · 11 behind Bonds's 73 pace
Hits Leader
Otto Lopez
MIA
131H
206 projected H · 36 behind Suzuki's 262 pace
Stolen Base Leader
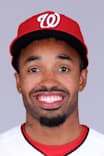
Nasim Nuñez
WSH
37SB
58 projected SB · 46 behind Henderson's 130 pace
Doubles Leader
Otto Lopez
MIA
272B
42 projected 2B · 16 behind Webb's 67 pace
Triples Leader
123B
19 projected 3B · 11 behind Wilson's 36 pace
Strikeout Leader

173K
275 projected K · record 383 (Nolan Ryan)
EXTREME
ERA Leader
1.57ERA
115.0 IP · chasing a sub-2.00 finish
ON PACE
Triple Crown Watch (AL)
Yordan Alvarez
HOU
.328AVG · 34 HR · 77 RBI
none higher AVG, none higher HR, none higher RBI full race on the Watch page
30/30 Club Pace
21/25HR/SB
33/40 projected HR/SB · team-game pace
ON PACE
Saves Leader
Cade SmithCLE
29SV
45 projected SV · record 62
EXTREME
Wins Leader (Team)

DodgersLAD
65W
102 projected wins · record 116
EXTREME
Run Differential Leader
DodgersLAD
+157
+247 projected run differential
Fastest Pitch of the Season
105.5MPH
4-Seam Fastball 2026-06-26