Payton Tolle threw an IMMACULATE INNING (inning 1: 3 K on 9 pitches) — immaculate innings (3 strikeouts on 9 pitches) happen about 4 times a season — and went 6.0 scoreless ▶︎ watch. Brody Hopkins made his MLB DEBUT and threw 1.0 innings, struck out 1 and allowed 2 runs ▶︎ watch.
Historic Chases · 2026-09-13
Nightly briefing
Baseball last night
The Padres have won 7 straight, and are 8-2 in their last 10.
CJ Abrams (WSH) is on a 30/30 pace — 30 HR and 29 SB, projecting to 32/31. Power and speed usually live in different bodies, which is why fewer than fifty players have ever managed both in one season. Both numbers have to land — that is what makes the club so small.
Lines of the night: George Springer, Vladimir Guerrero Jr., Kazuma Okamoto (TOR) went BACK-TO-BACK-TO-BACK — back-to-back-to-back home runs happen about 6 times a season; Two go-ahead plays: Lawrence Butler's walk-off home run in the 9th beat the Mariners 8-7 — and he hit 2 home runs, driving in 4 ▶︎ watch; Alec Bohm's tiebreaking double in the 8th put the Phillies ahead for good in a 9-4 win over the Braves ▶︎ watch. Three starts of note: Cam Schlittler (NYY) allowed one hit over 6.0 scoreless innings (8 K) ▶︎ watch; Emmet Sheehan allowed two hits over 6.0 scoreless innings (5 K) ▶︎ watch; Freddy Peralta went 5.0 scoreless ▶︎ watch.
Seasons on a historic footing: Jacob Misiorowski (MIL), 13.17 strikeouts per nine innings, 5th among the 9,603 qualified seasons on file, behind four seasons, led by Gerrit Cole's 13.82 in 2019; Dylan Cease (TOR), 12.77 strikeouts per nine innings, 6th.
Went deep more than once: Jonathan Aranda hit 2 home runs — his first career multi-homer game ▶︎ watch; Randy Arozarena (SEA) hit 2 home runs, driving in 4 ▶︎ watch.
Start streaks: Cam Schlittler (NYY) has struck out 8 or more in each of his last three starts (9, 10, 8).
What changed from last season: Pete Crow-Armstrong (CHC) — walk rate up from 4.7% to 11.8% (29 in 620 plate appearances in 2025, 77 in 655 this season); Jackson Merrill (SD) — stolen bases up from 1 in 115 games in 2025 to 26 in 146 this season; Nolan Arenado (AZ) — strikeout rate up from 12.2% to 22.6% (49 in 401 at-bats in 2025, 110 in 487 this season); Taylor Ward (SEA) — home-run rate down from 6.2% to 1.4% (36 in 579 at-bats in 2025, 7 in 489 this season). (2 more cleared the same bar.) 6 of 794 rate comparisons across 153 qualified hitters and pitchers, corrected for having looked that many times.
Also last night: Pete Alonso (BAL) reached 100 RBI for the season; The Tampa Bay Rays beat the Houston Astros 14-4 — all nine starters hit safely, 15 hits through the order.
Sweep watch: the Padres swept the Giants (3 games) — their 3rd sweep in 24 days. 3 other clubs were swept the same night.
That morning's stakes
What we were watching
Reid Detmers (LAA) is the probable starter and needs 9 strikeouts to reach 200 this season. Next scheduled opponent: Seattle Mariners.
Historical intelligence
How the night stacked up
Kyle Schwarber versus the great home-run seasons
Kyle Schwarber has 44 home runs through 150 team games, 22 behind Barry Bonds's 2001 pace at the same checkpoint (66). Comparable chases finished with a median of 46 (95% CI 45-47); 3.6% reached 50 (1.4-8.8% at 95% confidence), from 112 comparable seasons.
Retrosheet · verified play-by-playA franchise record is under pressure
The Rays' single-season record is 198 hits, set by Aubrey Huff in 2003. Yandy Díaz projects to 188 and would finish 10 short.
SABR Lahman Baseball Database · through 2025This is an unusual batter-strikeout climate
MLB teams are averaging 8.35 batter-strikeout events per team game. The last completed season at least this high was 2025. The stored historical peak is 8.81 in 2019.
SABR Lahman Baseball Database · through 2025Whose season does Kyle Schwarber resemble?
The completed season closest to Kyle Schwarber's projected shape is Anthony Santander's 2024 (86% similarity). The match is strongest in run production, hit volume, speed; the largest difference is power. This is a comparison, not a forecast of how the season must finish.
SABR Lahman Baseball Database · through 2025Closest to .400

Luis Arraez
PHI
.313AVG
82 consecutive hits needed to reach .400
IMPOSSIBLE
Home Run Leader
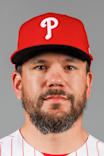
Kyle Schwarber
PHI
44HR
48 projected HR · 22 behind Bonds's 73 pace
Hits Leader
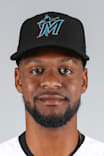
Otto Lopez
MIA
180H
194 projected H · 63 behind Suzuki's 262 pace
Stolen Base Leader
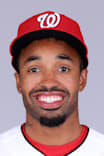
Nasim Nuñez
WSH
46SB
49 projected SB · 75 behind Henderson's 130 pace
Doubles Leader

362B
39 projected 2B · 26 behind Webb's 67 pace
Triples Leader
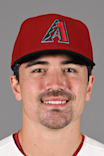
163B
17 projected 3B · 17 behind Wilson's 36 pace
Strikeout Leader
Dylan Cease
TOR
236K
255 projected K · record 383 (Nolan Ryan)
IMPOSSIBLE
ERA Leader

Cam Schlittler
NYY
1.95ERA
184.2 IP · chasing a sub-2.00 finish
ON PACE
Triple Crown Watch (AL)
Yordan Alvarez
HOU
.310AVG · 38 HR · 96 RBI
leads AVG, 2 back HR, 4 back RBI 6.5% over 20,000 simulated seasons · full race on the Watch page
30/30 Club Pace
41/36HR/SB
44/39 projected HR/SB · team-game pace · 1 other in the hunt
ACHIEVED
Saves Leader
Bryan BakerTB
40SV
43 projected SV · record 62
EXTREME
Wins Leader (Team)

BrewersMIL
93W
100 projected wins · record 116
IMPOSSIBLE
Run Differential Leader
BrewersMIL
+195
+211 projected run differential
Fastest Pitch of the Season
105.5MPH
4-Seam Fastball 2026-06-26